A deep learning approach to predict the depth and extent of supraglacial lakes on the Greenland Ice Sheet using Copernicus Sentinel-2 imagery was presented at the first Global Space Conference on Climate Change (GLOC).
The Greenland Ice Sheet has lost over 4000 Gigatonnes of ice in the past three decades alone. In the context of our accelerating climate crisis, understanding the meltwater dynamics and hydrology of this ice sheet is a vital part of quantifying and predicting sea level rise.
Copyright:Owned by davewalshphoto.com. Reproduction not permitted in any form or means
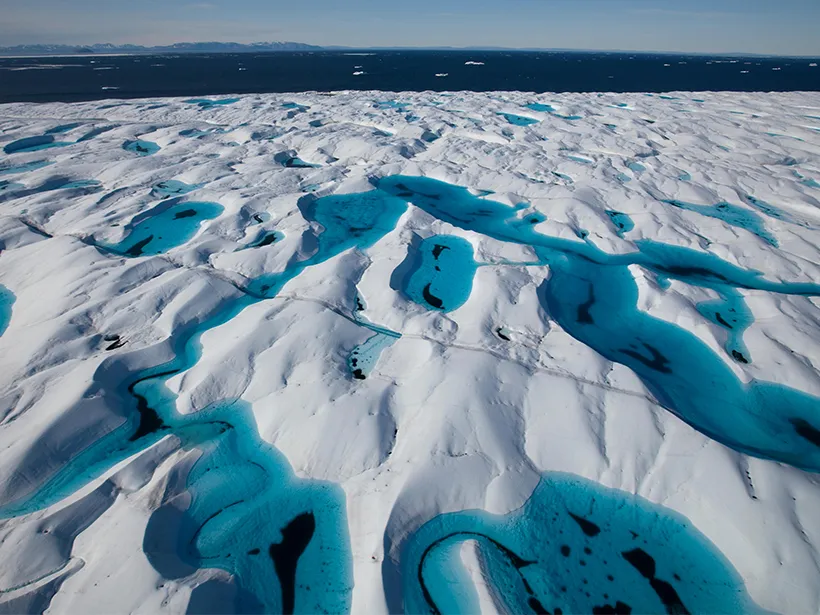
Supraglacial lakes on Petermann glacier in Greenland
One piece of this ice mass loss system are dynamic lakes - so-called supraglacial lakes (SGLs) - which form on the surface of the ice sheet. These temporary reservoirs of water are created when meltwater accumulates during the melt season, from May to October.
The lakes are found on the periphery of ice sheet in topographic depressions and can be problematic by increasing glacier flow speed and lowering ice albedo. They drain either by forming streams across the ice surface or vertically through shafts in the ice sheet.
Monitoring the size of these fluctuating lakes can improve our understanding of the changing Greenland Ice Sheet and its contribution to sea level rise.
A research team led by Science [&] Technology, Norway, have harnessed the spectral signatures of Sentinel-2 imagery from the Copernicus Space Programme to map not only the extent, but also the depth of Greenland’s SGLs. The project is part of ESA’s Greenland Ice Sheet Climate Change Initiative (ESA GIS CCI+).
Presenting the research method and results at a technical session at GLOC, Abigail Robinson, study lead author and remote sensing scientist at S[&]T, says, “Existing methods used optical imagery from Sentinel-2 data to measure the extent of supraglacial lakes, but measuring depth can only be done using laser altimeters on satellites such as IceSat-2.
Copyright:ESA
Abigail Robinson at GLOC
“Since IceSat-2 has relatively sparse spatial and temporal coverage, we decided to develop a deep learning algorithm to improve lake depth monitoring.”
In a nutshell, the new method meant that Sentinel-2 imagery were used to train a U-Net Deep Learning model to predict SGLs extent and depth. Predefined lake extent labels and IceSat-2 tracks were used to train the network.
The chosen study area was in northeastern Greenland, in the Nioghalvfjerdsbræ and Zachariae Isstrøm glaciers, which are thought to be strongly affected by climate change. The 2019 summer melt season (May to October) was chosen as the study period.
Preliminary results show that the methodology is feasible as, despite data limitations, the output model successfully produces a reasonable lake extent and depth prediction.
Copyright: QGreenland
Study area
“The model can predict lake extent very well and easily estimates depth for shallow lakes. It works particularly well with round, isolated, and singular lakes, although debris on the ice and slush can confuse the model in extent prediction,” adds Robinson.
As part of the model validation, the overall accuracy of the model was calculated. The best performing version achieved an overall accuracy score of 99%, which means almost 100% of all pixels were correctly predicted as either lake or background. Additionally, the model predicted lake depth with an average error 1 m. Despite being preliminary work, these statistics are very promising.
Currently the input images are from the Copernicus Sentinel-2 Level-1c product and the 10 m bands (B02, B03, B04, B08), but the research team aims to improve data quality by using all Sentinel-2 bands.
There are also opportunities for improving the functionality of the model by including other optical sensors, such as Landsat-8 and -9, and radar altimetry measurements from CryoSat-2 and synthetic radar aperture measurements from Sentinel-1.
About the Copernicus Sentinels
The Copernicus Sentinels are a fleet of dedicated EU-owned satellites, designed to deliver the wealth of data and imagery that are central to the European Union's Copernicus environmental programme.
The European Commission leads and coordinates this programme, to improve the management of the environment, safeguarding lives every day. ESA is in charge of the space component, responsible for developing the family of Copernicus Sentinel satellites on behalf of the European Union and ensuring the flow of data for the Copernicus services, while the operations of the Copernicus Sentinels have been entrusted to ESA and EUMETSAT.
Did you know that?
Earth observation data from the Copernicus Sentinel satellites are fed into the Copernicus Services. First launched in 2012 with the Land Monitoring and Emergency Management services, these services provide free and open support, in six different thematic areas.
The Copernicus Land Monitoring Service (CLMS) provides geographical information on land cover and its changes, land use, vegetation state, water cycle and Earth's surface energy variables to a broad range of users in Europe and across the World, in the field of environmental terrestrial applications.
It supports applications in a variety of domains such as spatial and urban planning, forest management, water management, agriculture and food security, nature conservation and restoration, rural development, ecosystem accounting and mitigation/adaptation to climate change.
References:
[1] Detecting Supraglacial Lakes on Greenland from Deep Learning of Sentinel-2 and IceSat-2 data -GLOC 2023
[2] Pope, A. “Reproducibly estimating and evaluating supraglacial lake depth with Landsat 8 and other multi-spectral sensors,” Earth and Space Science, 2016
[3] Yang, K. et al. “Seasonal evolution of supraglacial lakes and rivers on the southwest Greenland Ice Sheet,” Journal of Glaciology, 2021
[4] Pope, A. et al. “Estimating supraglacial lake depth in West Greenland using Landsat 8 and comparison with other multispectral methods,” The Cryosphere, 2016
