Ice Monitoring
High-resolution ice charting services supply ice classification and iceberg data to national coast guards, navies and shipping companies, to assist in assuring safe year-round navigation in the ice-covered Arctic and sub-Arctic zones. For sea-ice, information on ice concentration, extent, type, thickness and drift velocity can be determined. The location, size and drift of icebergs can also be collected. Sentinel-1 dual polarisation data can significantly improve ice classification and discrimination.
Through the detection of changes in the Arctic sea-ice extent, Sentinel-1 can be used to assess environmental impacts on coastal areas and transportation.
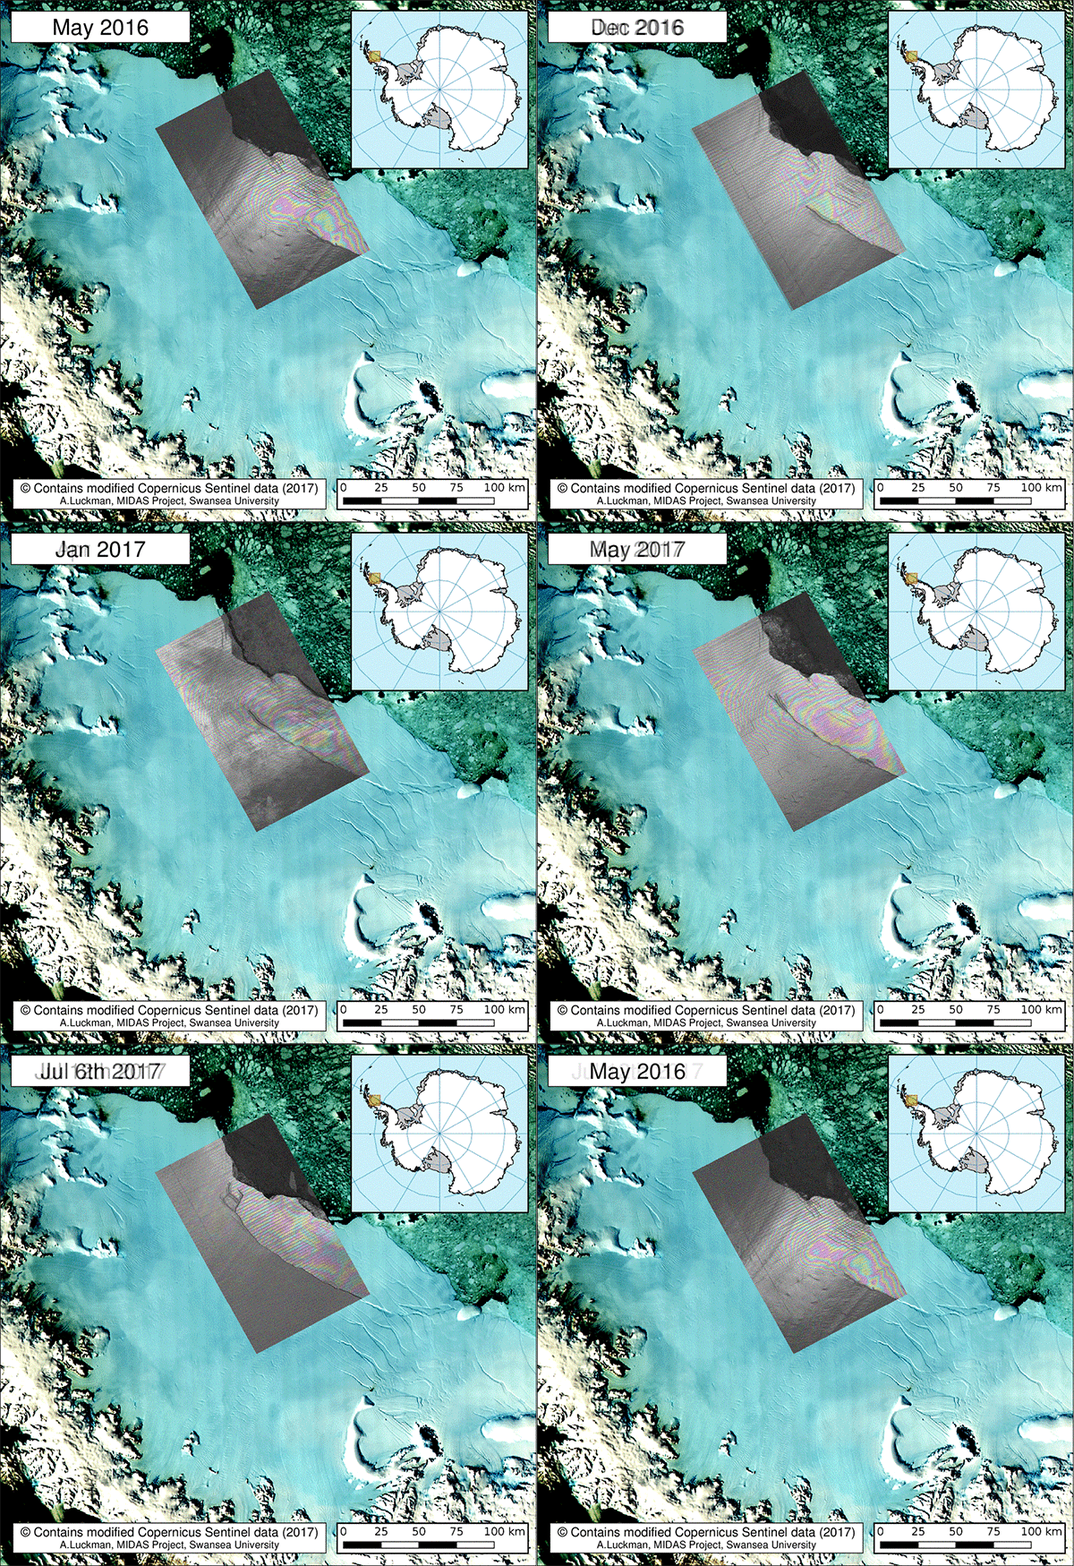
Figure 1: Monitoring of Antarctica's Larsen C ice shelf by the Copernicus Sentinel-1 mission between May and July 2016. Contains modified Copernicus Sentinel Data [2016-2017].
Ship Monitoring
Sentinel-1 uses wide area coverage with improved revisit times and is able to potentially detect smaller ships than Envisat's ASAR instrument. The mission's ability to observe in all weather and in day or night time, makes it ideal for precise cueing and location of ship activities at sea, allowing for more efficient and cost-effective use of other security assets, such as patrol aircraft and ships. Data relevant to ship detection are transmitted by the satellite in real-time for reception by local collaborative ground stations supporting European and national services.
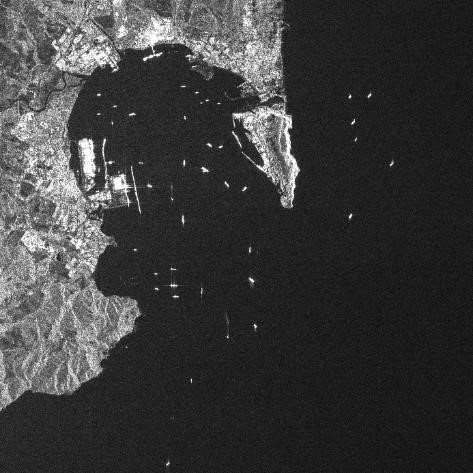
Figure 2: Illustration of vessels observed between Gibraltar and Algesiras on September 2017, Copernicus Sentinel Data [2017]
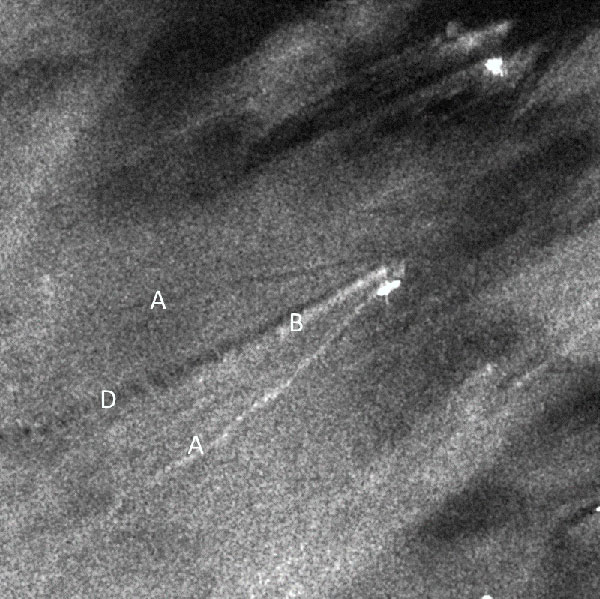
Figure 3: Classical ship wake pattern on SAR imagery (S-1A Stripmap, Copernicus Data [2015]) with a local wind speed of 2 m/s. A/ Kelvin "V" wave dark and bright on each side, B/ Narrow "V" wave, D/ Turbulent wave
Oil Pollution Monitoring
Oil detection applications are used for gathering evidence of illegal discharges, analysing the spread of oil spills and prospecting for oil reserves by highlighting naturally occurring seepage. Oil slicks are distinctly visible in SAR imagery as characteristically dark features. Most oil slicks are caused by ships emptying bilge before entering port. Detections can be correlated with Automatic Identification System (AIS) or Long-Range Identification and Tracking (LRIT) information broadcasts from ships to determine sources and prosecute offenders. Data relevant to oil spill monitoring are transmitted by the satellite in real-time for reception by local collaborative ground stations supporting European and national services.
Likewise, detection of naturally occurring oil seepage from the ocean floor can provide clues for oil prospecting.
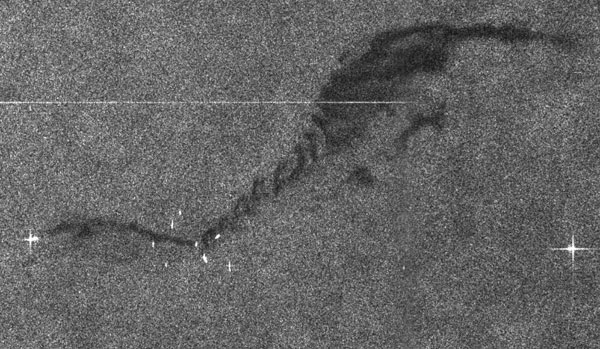
Figure 4: Oil spill observed off the Belgian coast near Zeebrugge on 08/10/2015 after a collision between two vessels. Contains modified Copernicus Sentinel data [2015].
Figure 5: Oil Spill Monitoring from Space Using SAR
Marine Winds
SAR is sensitive to spatially varying surface roughness patterns caused by winds on the ocean surface. Sentinel-1 ocean products, in conjunction with global ocean wave models, help determine the direction, wavelength and heights of waves on the open oceans and assist in weather prediction, ship transportation and wave energy applications.
Wind field estimates also play an important part in oil spill monitoring to help descriminate look-alikes from actual spills.
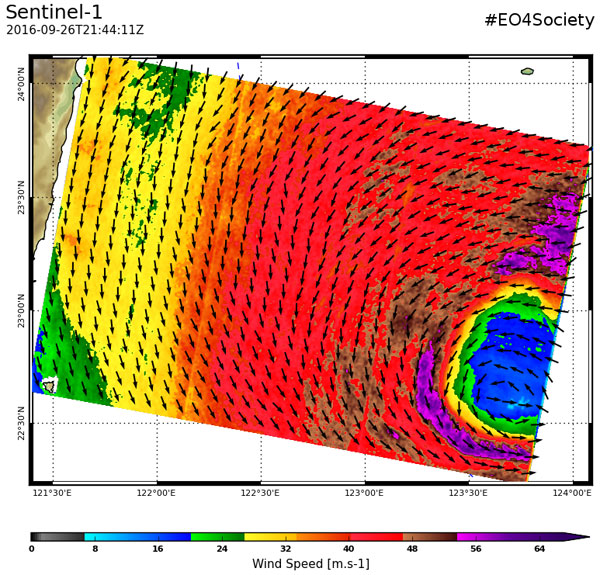
Figure 6: Wind speed derived from Sentinel-1 data over the Typhoon Megi, processed as part of the ESA/SEOM 4 Science/Ocean Study project #EO4Society. Contains modified Copernicus Sentinel data [2016].
Furthermore, Sentinel-1 will provide data on the interactions between ocean waves and currents allowing the visualisation of large-scale ocean currents, cold/warm water masses, coastal water currents, and internal waves.