Flood Monitoring
Over 75% of natural disasters that occur worldwide involve flooding. SAR's inherent capability to observe during cloud cover and Sentinel-1's frequent revisits makes it ideal for flood monitoring. It can be used to assess the extent of flooded areas and the impact on human, economic and environmental loss.
Figure 1: Sentinel-1's SAR's ability to penetrate through all weather conditions together with its ability to easily detect flooded areas, provides the best tool for monitoring floods from space.
Furthermore, high-resolution digital elevation models (DEMs) generated through Sentinel-1's interferometric modes can be used to conduct run-off and inundation analysis in areas previously lacking elevation data.
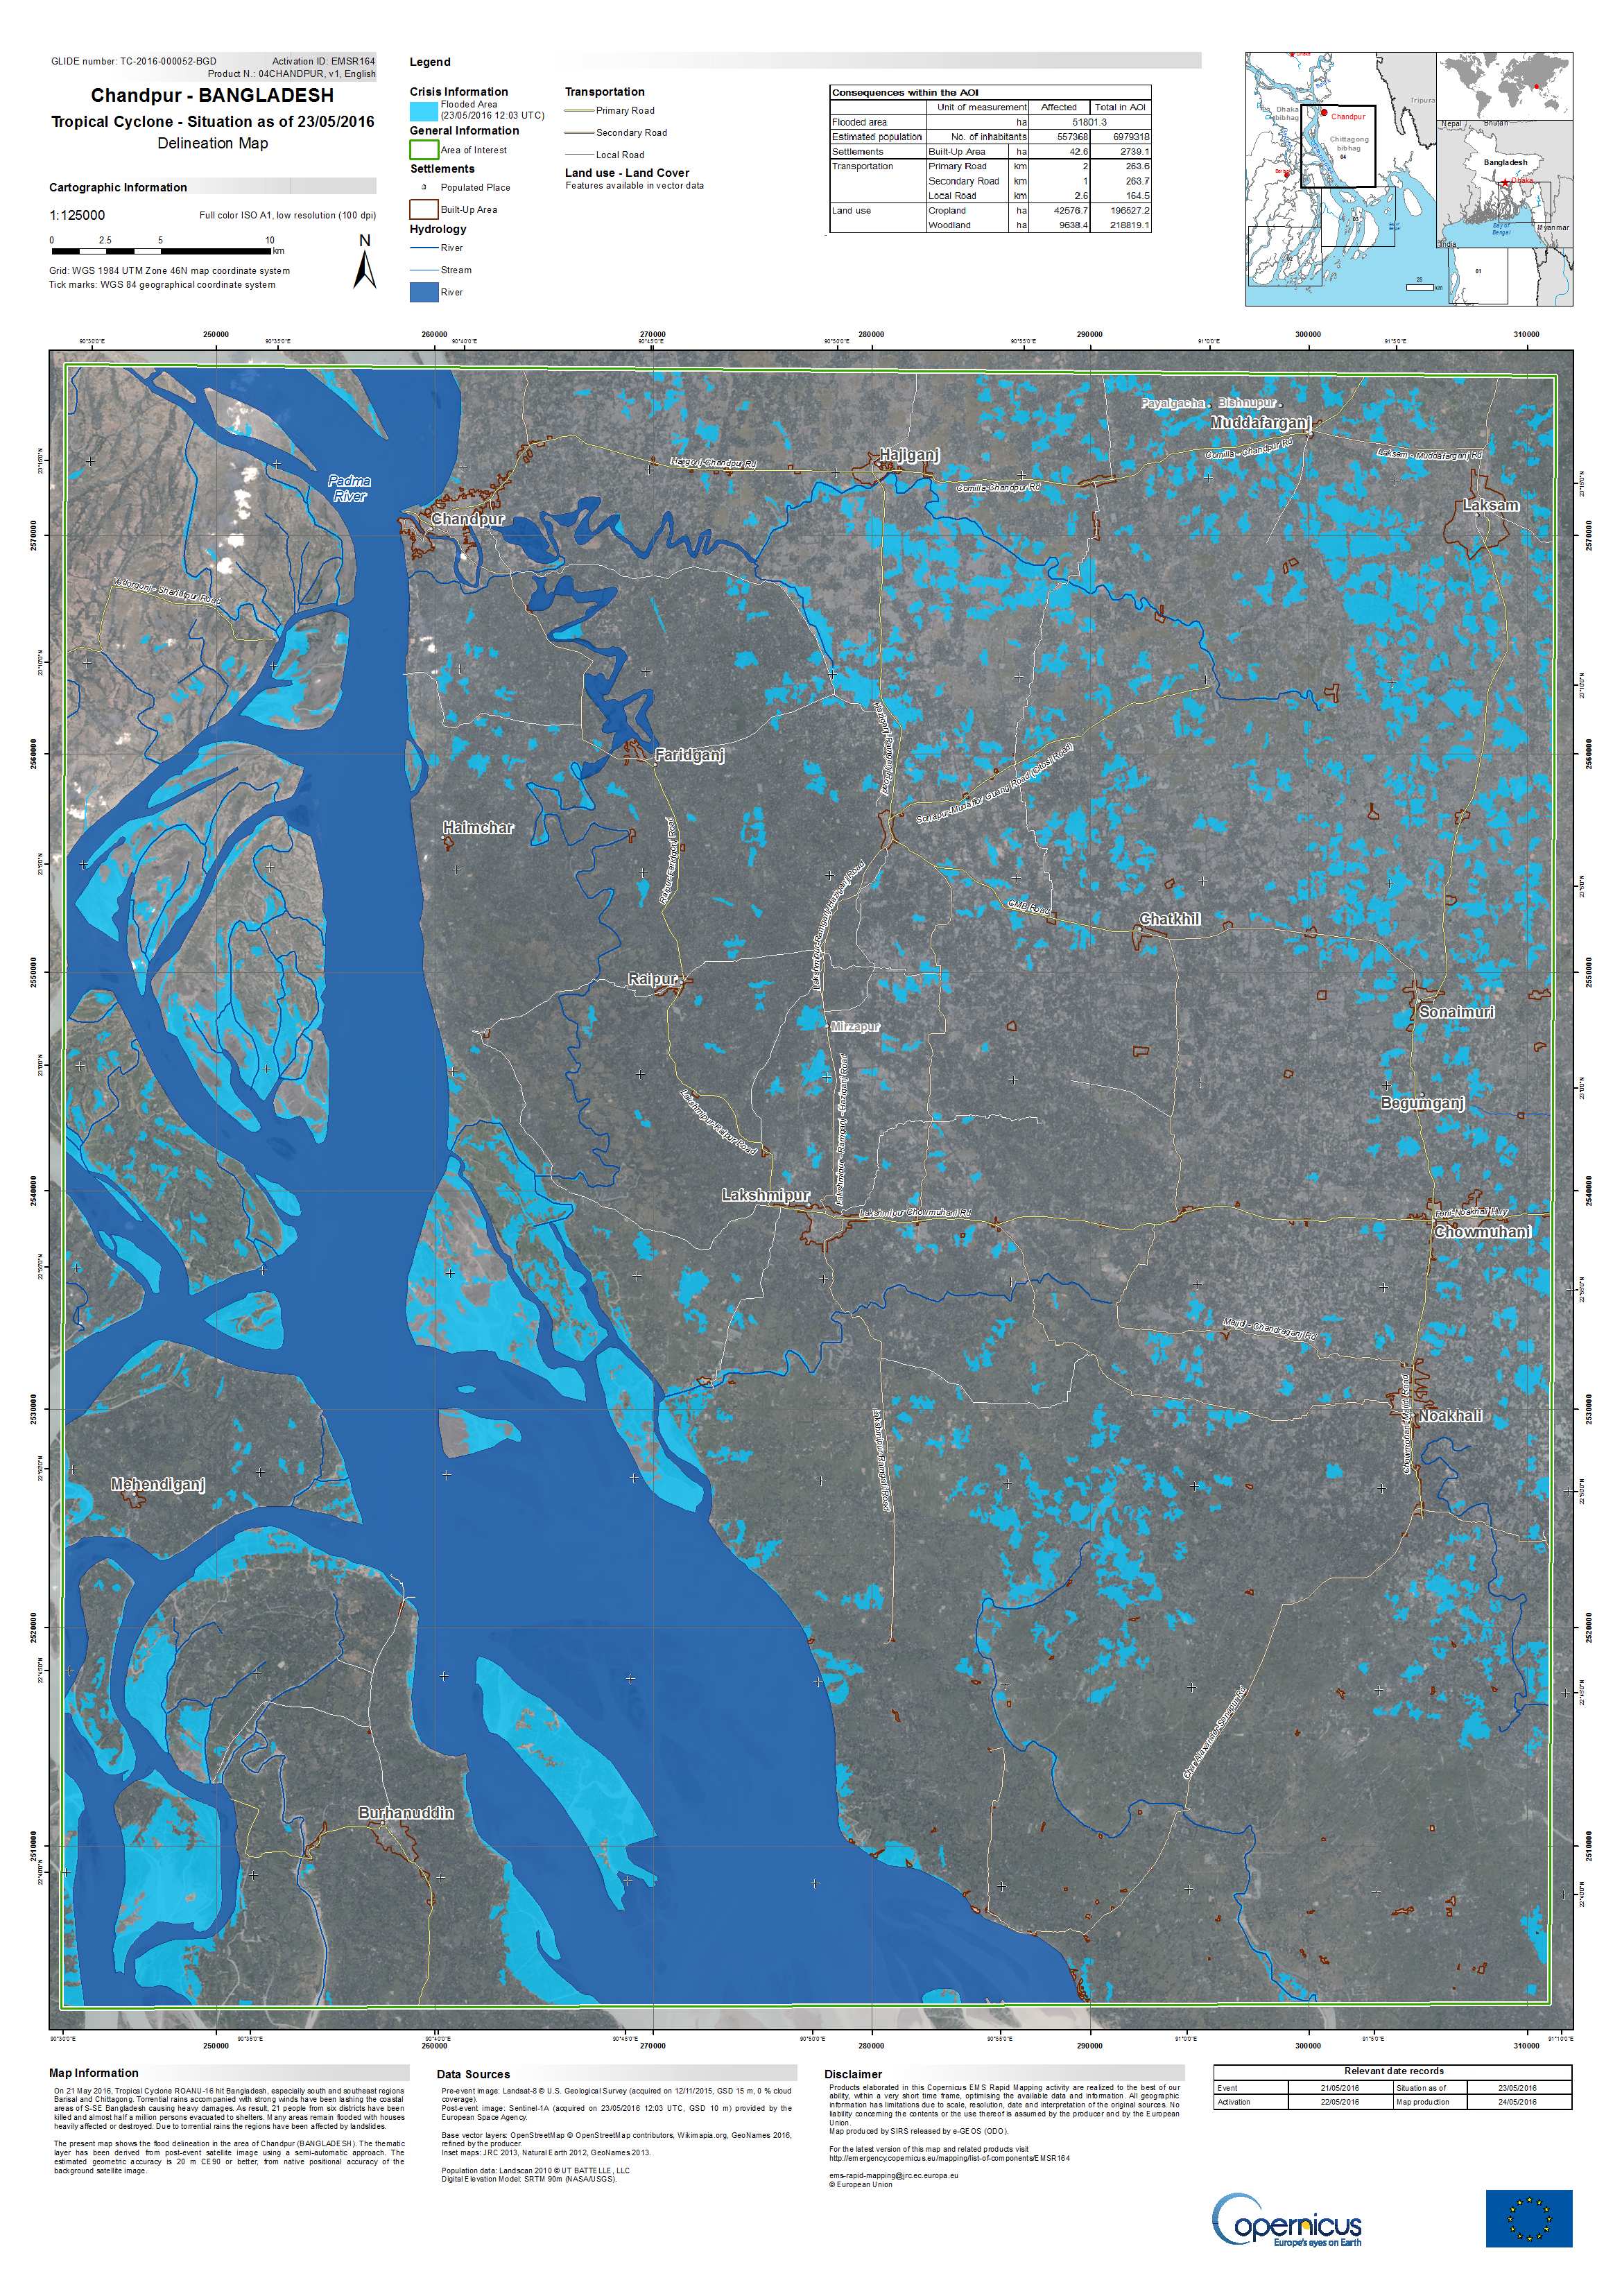
Figure 2: Mapping of flooded areas in Bangladesh in 2016 from semi-automatic classification of Sentinel-1 data. Map generated as part of the Copernicus Emergency Management Service (EMS)
Earthquake Analysis
InSAR provides the unique ability to produce medium and high-resolution maps of earthquake deformations. Through the persistent monitoring of earthquake-prone areas, active fault lines can be discovered and potential risks can be studied. The Interferometric Wide swath mode will make it easier to monitor very large scale earthquakes.
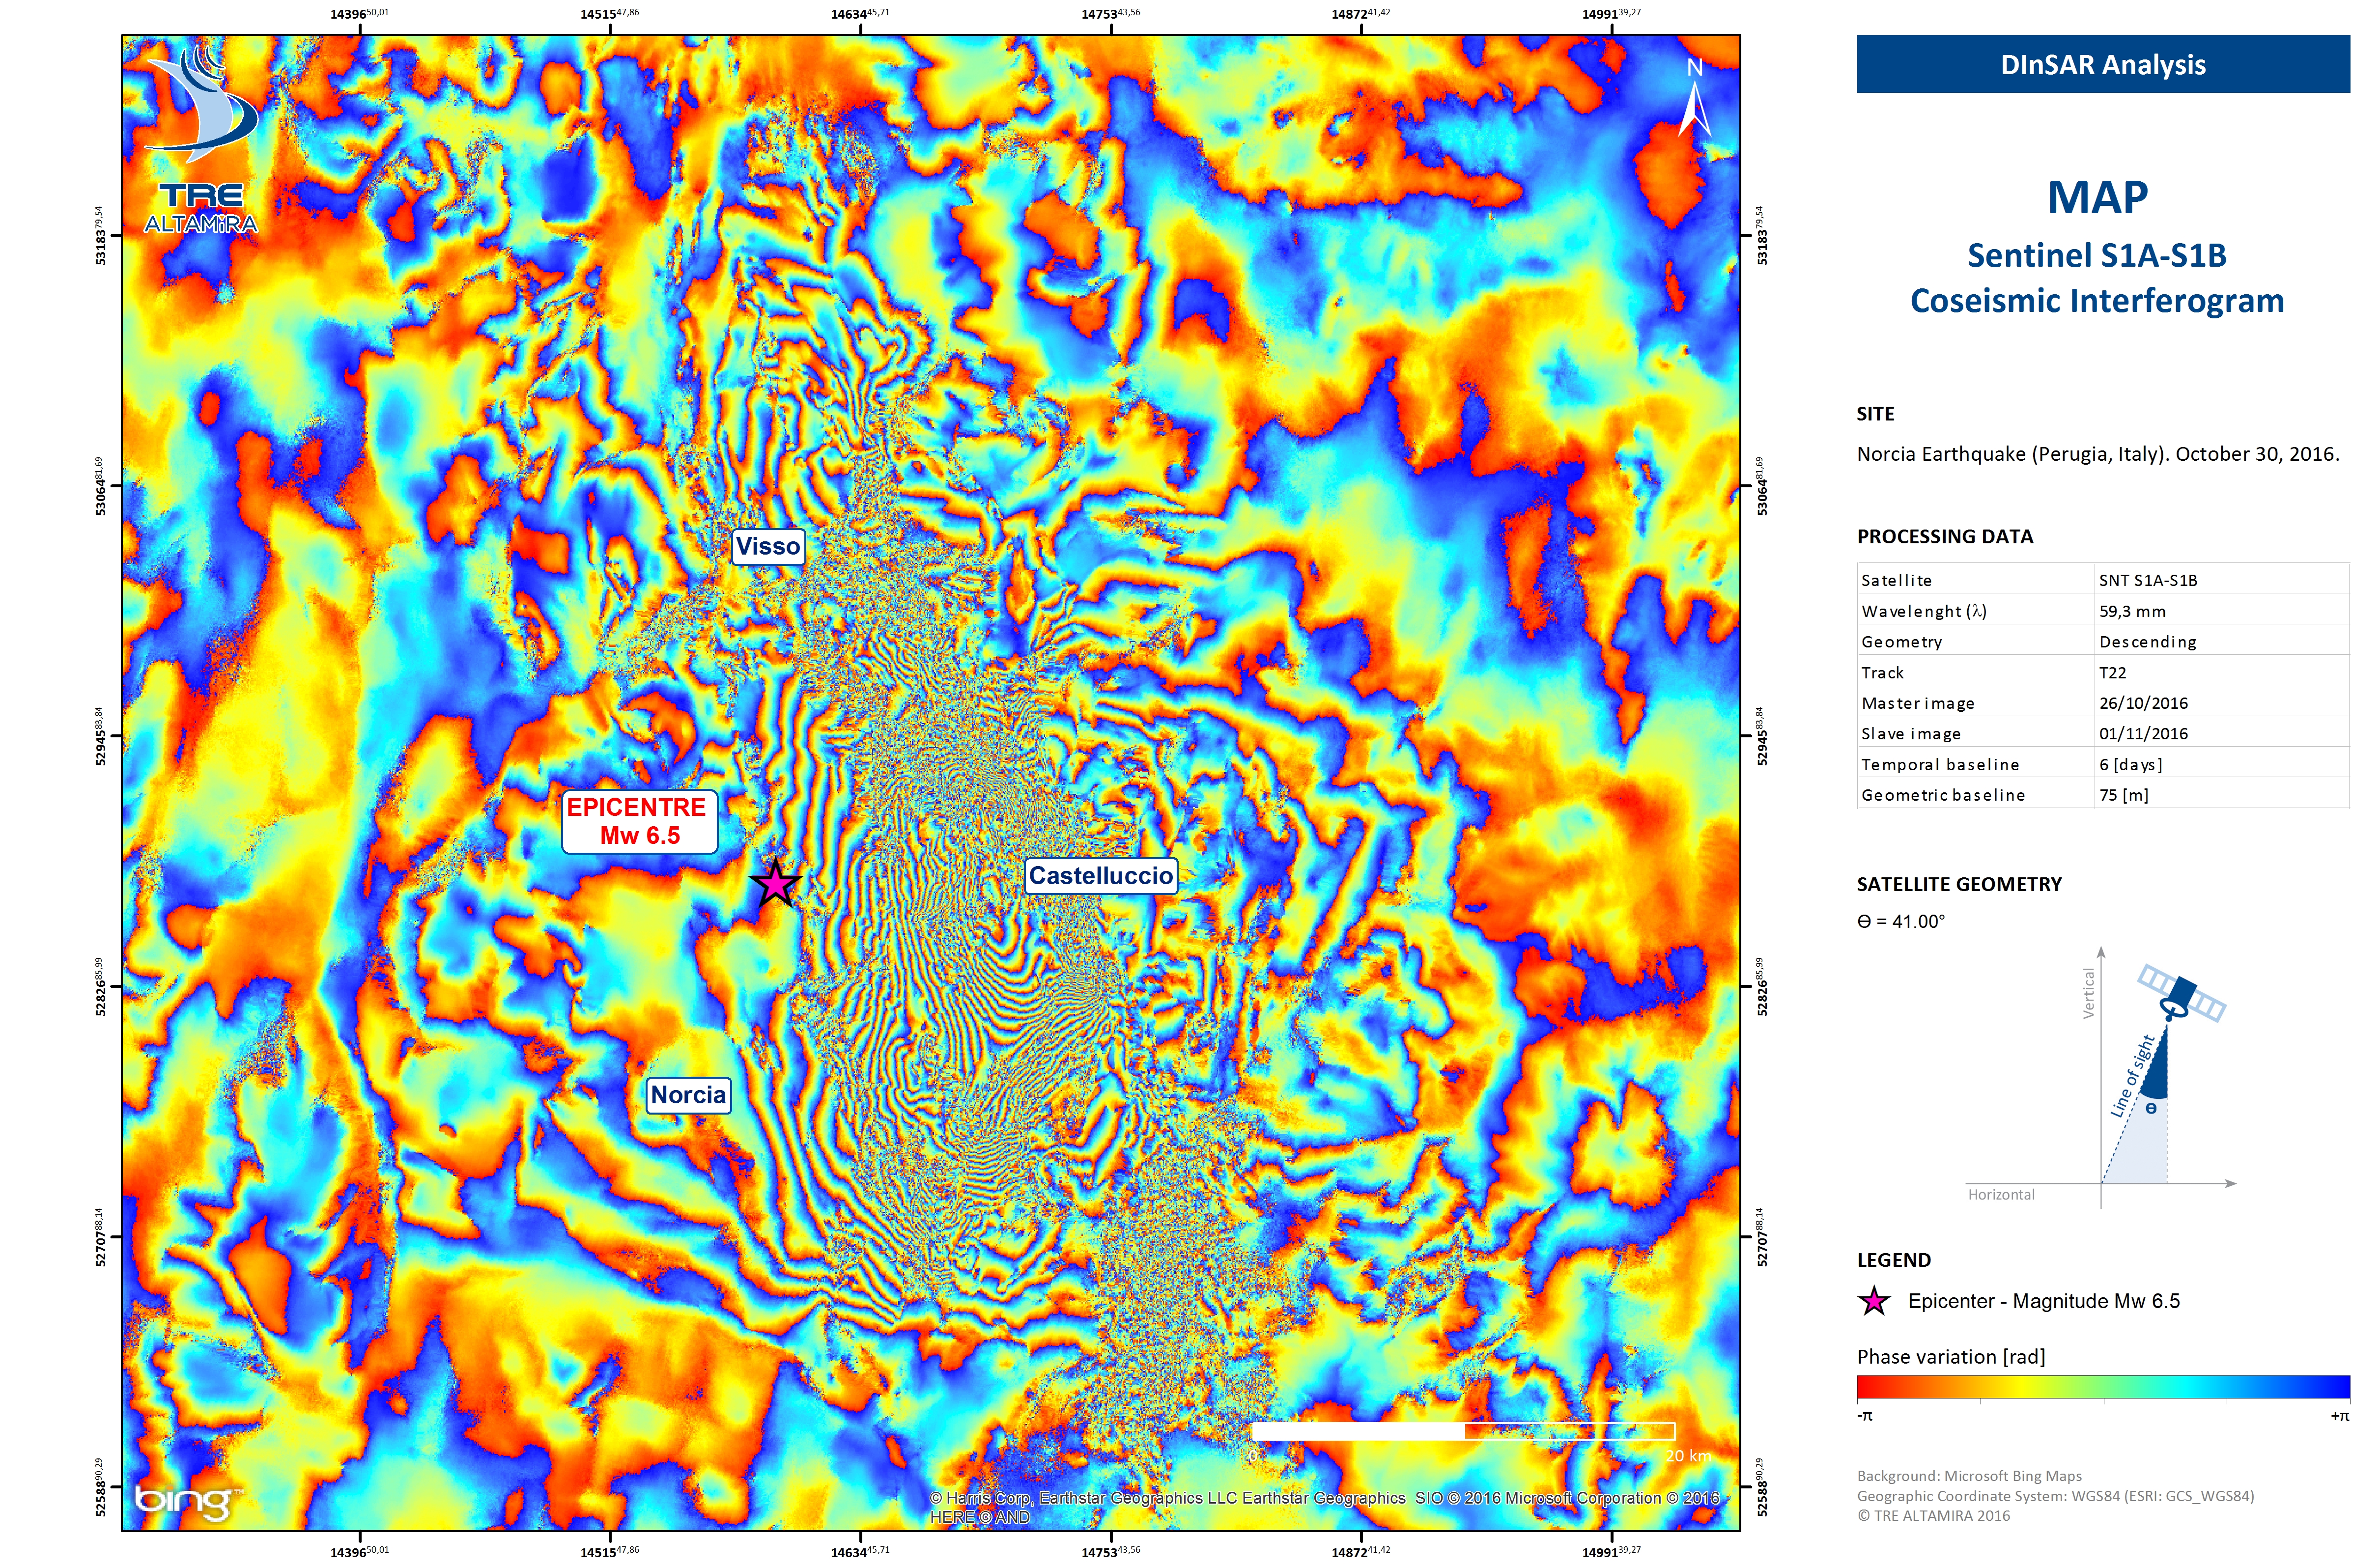
Figure 3: SAR coseismic interferogram on the 2016 central Italy earthquake processed by TRE ALTAMIRA. Each colour cycle (red-blue-yellow) represents approximately 3 cm of motion in the radar line of sight
Landslide and Volcano Monitoring
SAR interferometry can locate areas prone to landslides and monitor surface deformation to provide early warning of potential disasters and monitoring of critical infrastructure. Pre-eruption uplift and post eruption volcanic shrinkage can be monitored with similar interferometric techniques and can complement in-situ networks from volcano observatories. InSAR monitoring can help detect first signs of increasing levels of volcanic activity, preceding earthquakes and other precursors that may signal eruptions.
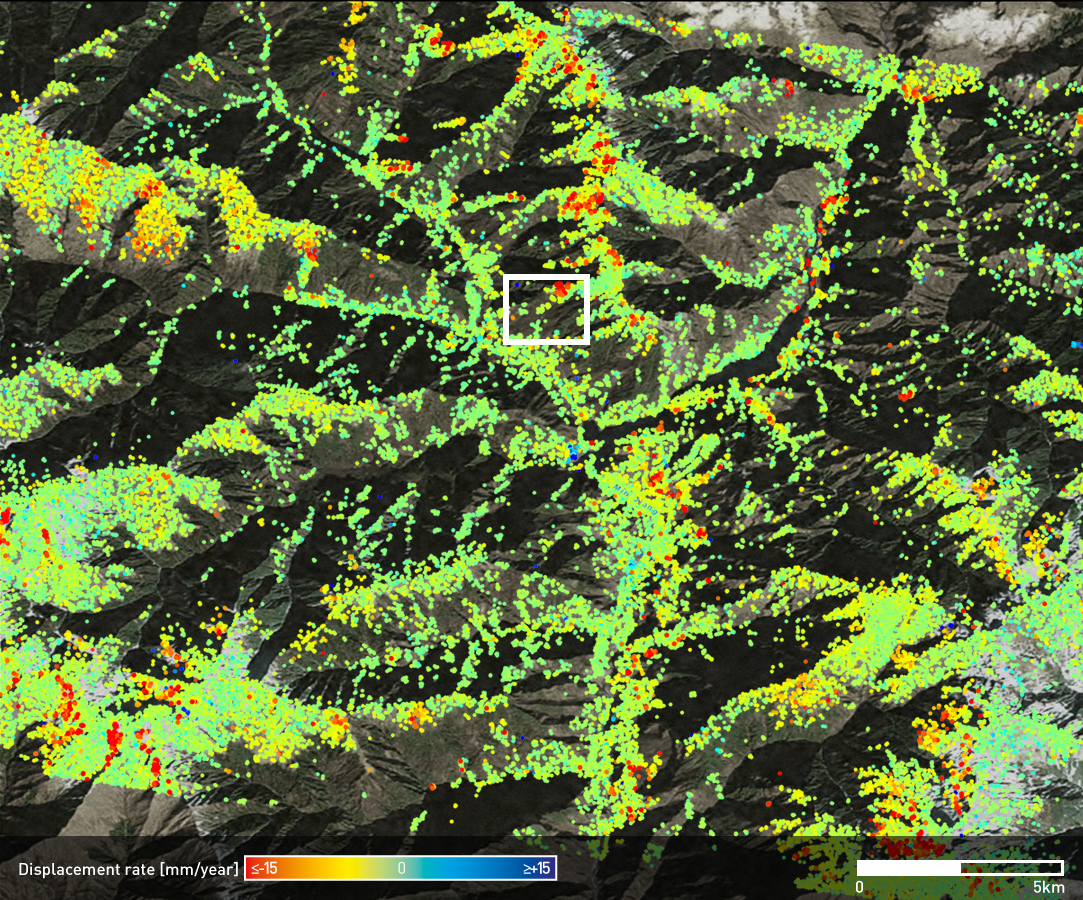
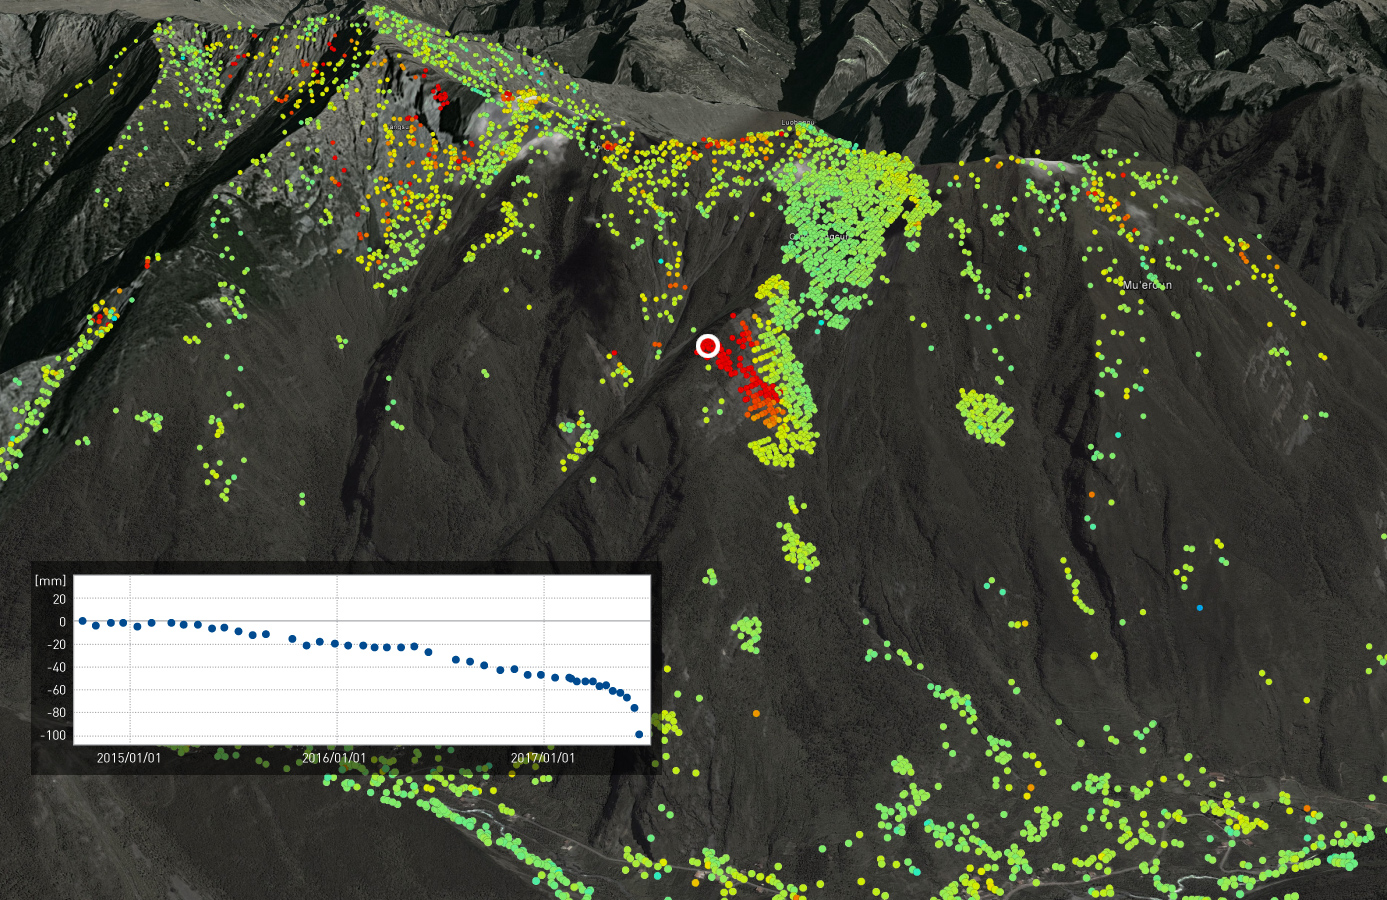
Figure 4: SqueeSARTM measurements over the Maoxian county for the period October 2014 - June 2017 (top) and measurements over the landslide area (bottom). The displacement time series superimposed reveals clear precursory movement months before the event.
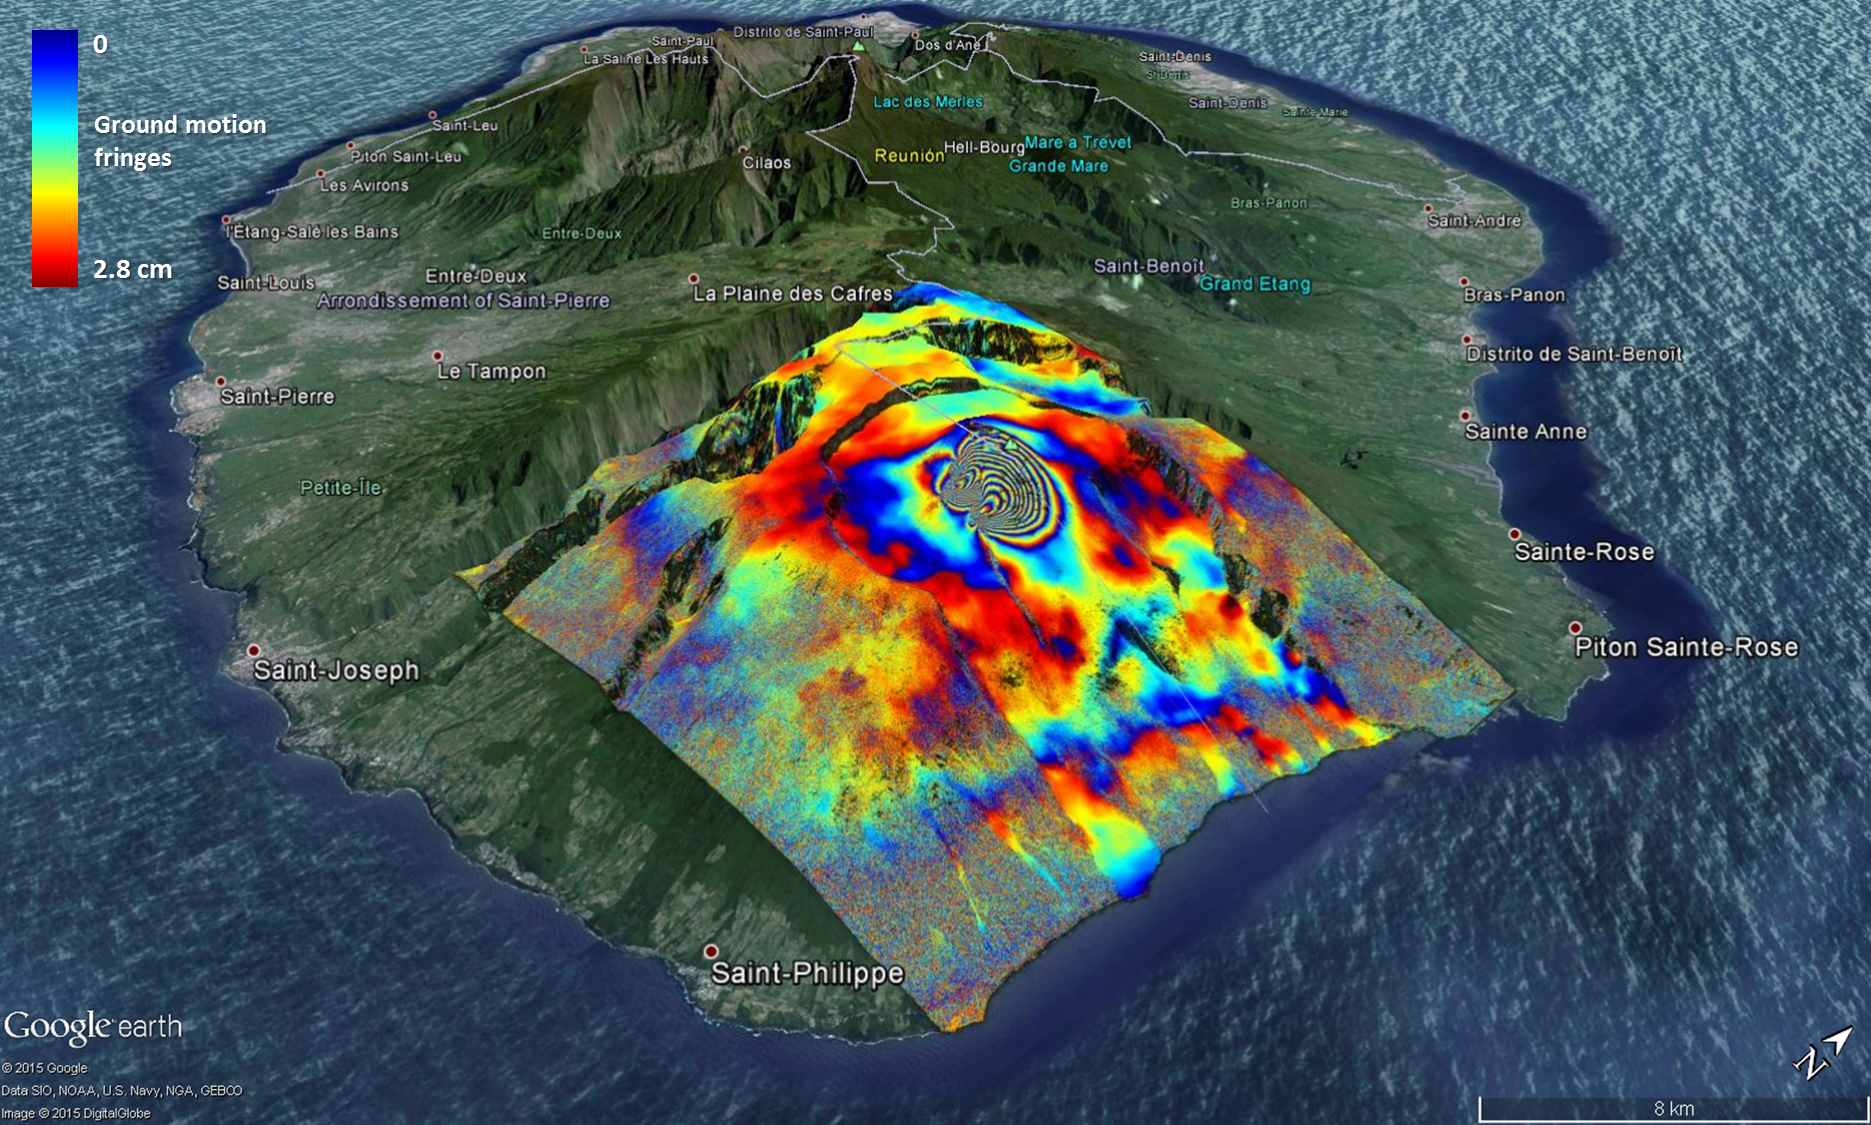
Figure 5: SAR interferogram processed by TRE ALTAMIRA capturing the deformation occurred in the volcano Piton de la Fournaise (Reunion Island) in May 2015. The complete colour cycles red-blue-yellow (fringes) in the image indicate surface motion. Each fringe represents approximately 3 cm of ground motion gradient. The pattern of deformation in the crater area is clearly observed.