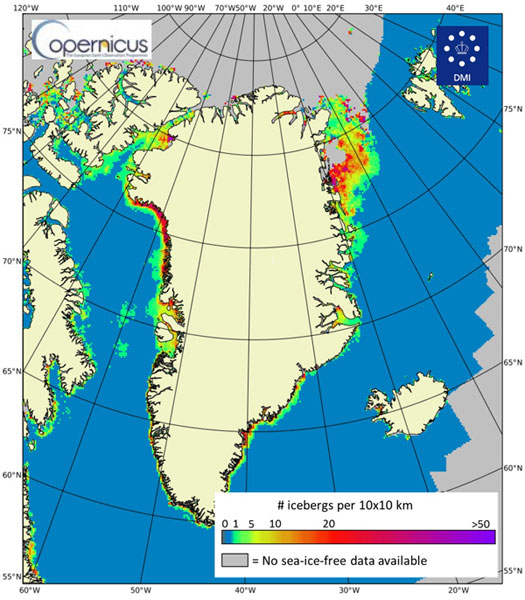
Title: Greenland iceberg chart
Description:
A Sentinel-1 derived chart of the median (considered the normal) amount of icebergs present around Greenland, based on two years of observations.
To generate the chart, the displayed area has been divided into 10 x 10 km squares, in which icebergs are counted every time there is a Sentinel-1 overpass. Each of these 10 x 10 km squares represents a two-year time series of iceberg concentration. Statistics are calculated for each of these time series, i.e. at 10-km gridded spatial resolution.
Copyright: Contains modified Copernicus Sentinel data (2016)/processed by DMI
