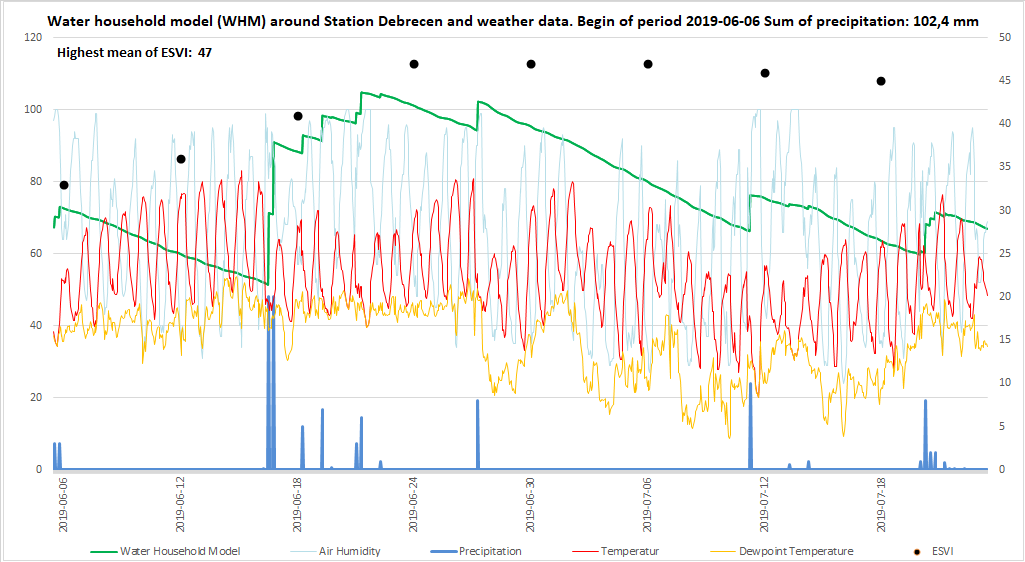
Title: Time-series diagram with weather data, the water household model (WHM) and mean value of ESVI
Description: The weather data drives the WHM, here represented by the green line. The ESVI values are marked with black dots. The values for air humidity and the WHM can be seen on the left y-axis. Temperature, rainfall and ESVI are drawn on the right y-axis. On the x-axis only those dates when the satellite passed by are visible.
Copyright: Diagram developed by Cropix