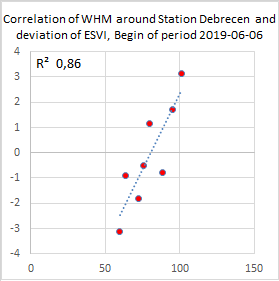
Title: Correlation diagram
Description: Correlation between mean ESVI over the period of 48 days, which adds to eight acquisitions of Copernicus Sentinel-1 satellites and the relevant values on the same dates from the water household model.

Title: Correlation diagram
Description: Correlation between mean ESVI over the period of 48 days, which adds to eight acquisitions of Copernicus Sentinel-1 satellites and the relevant values on the same dates from the water household model.
The Sentinel Success Stories describe
how Copernicus Sentinel data are benefiting society and business