Title: Time lapses of NDWI and cyanobacteria distribution maps in the Guadiana River
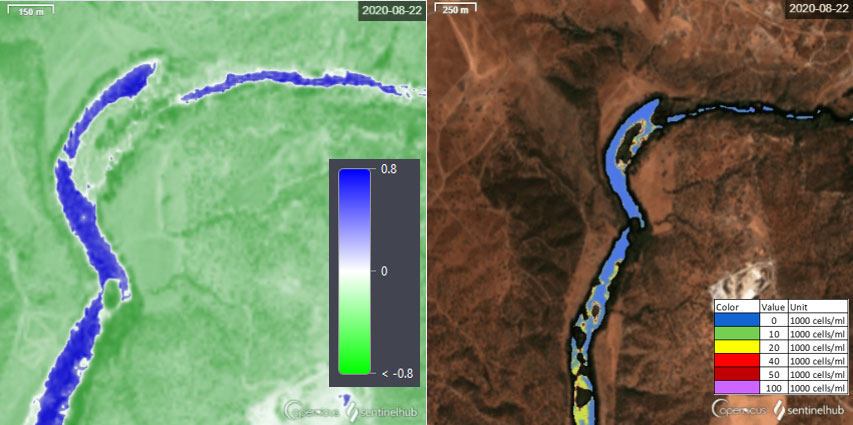
Description: These images feature screenshots of two time lapses of the distribution maps of Normalised Difference Water Index (NDWI) - on the left - and cyanobacteria - on the right - the latter generated with a custom script. Both images were generated in the EO-Browser web-platform for cloud-computing, using L2A Copernicus Sentinel-2 products.
The NDWI index is very useful to map water bodies (NDWI > 0.5) or, as in this case, a river. An observation of this index over the years allows us to identify the occurrence of drought periods and, comparing with the values of cyanobacteria during that period, to look for correlations between both events. This is particularly important in rivers with dams, since it can provide us with evidence of how effective the environmental flow is in preventing water stagnation, accumulation of organic matter and, consequently, harmful algae blooms in certain sections of rivers. With Copernicus Sentinel-2 images one can find what sections of the river are more affected and plan mitigation measures.
Copyright: Contains modified Copernicus Sentinel data (2020)/processed by M. Gaši, R. Zorkić, V. Korevaar