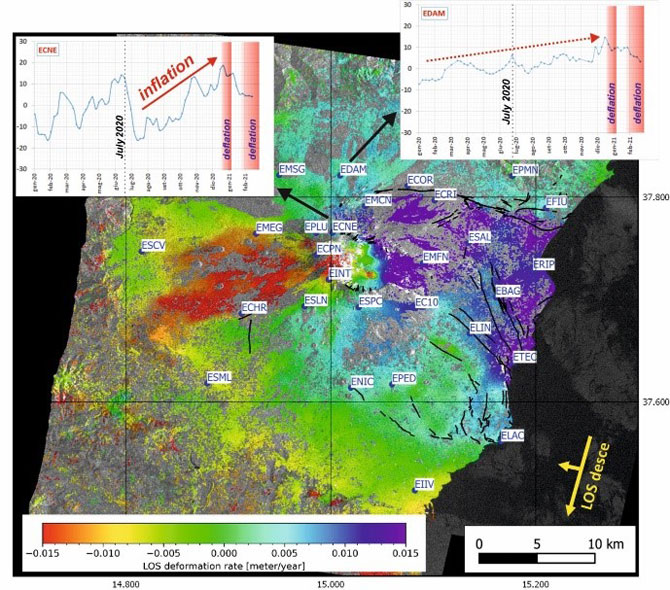
Title: Copernicus Sentinel-1 captures Etna's inflation
Description: This time series features Copernicus Sentinel-1A and -B IPTA Advanced DInSAR Analysis. Descending Mean LOS velocity map and time series relevant to 1 April 2020 and 21 February 2021.
Details of the time evolution of the inflation are reported in the two plots. The East flank shows the deformation related to the persistent flank motion (green-purple area).
Copyright: Contains modified Copernicus Sentinel data (2021)/ processed by INGV