BRAT (Broadview Radar Altimetry Toolbox) is a tool designed to read, process and visualise results from SENTINEL-3 products.
BRAT is also able to read most distributed radar altimetry data from ERS-1 and 2 (ESA), TOPEX/POSEIDON (NASA/CNES), GEOSAT Follow-On (US Navy), JASON-1 (CNES/NASA), ENVISAT (ESA), CRYOSAT (ESA) and JASON-2 (CNES/NASA/EUMETSAT/NOAA) missions.
BRAT is compatible with Linux, MAC OS and Windows operating systems.
APIs are available with data reading, date and cycle/pass conversion, and statistical computation functions for C, Fortran, IDL and MATLAB, allowing integration of BRAT functionality with custom applications.
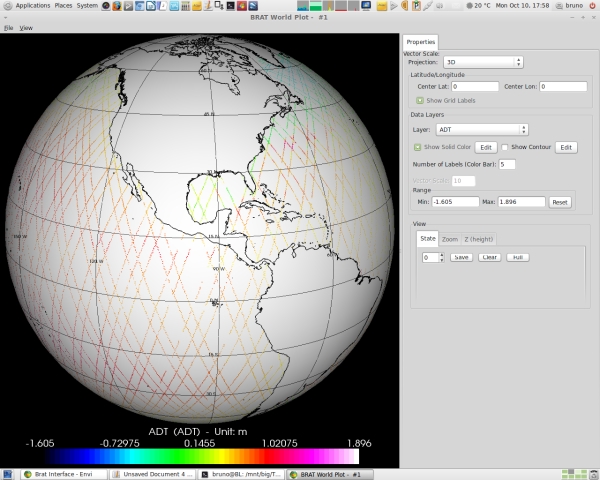
Figure 1: Along Track Plots of Absolute Dynamic Topography Using the Display Export Function of the BRAT Tool (Credit: ESA/CNES)
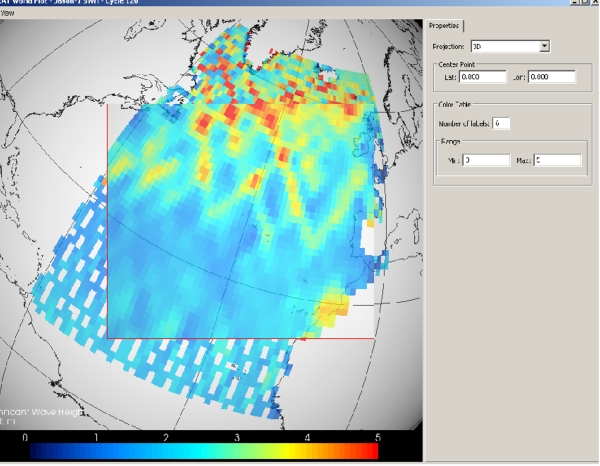
Figure 2: Data Resample Superimposed Showing Wave Height Using the Display Export function of the BRAT Tool (Credit: ESA/CNES)
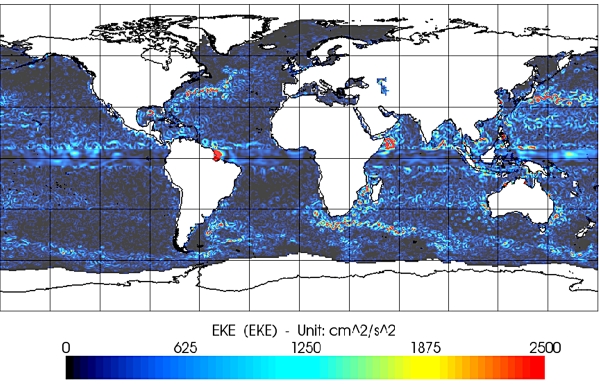
Figure 3: Worldwide Map Showing Kinetic Energy Using the Display Export function of the BRAT Tool (Credit: ESA/CNES)
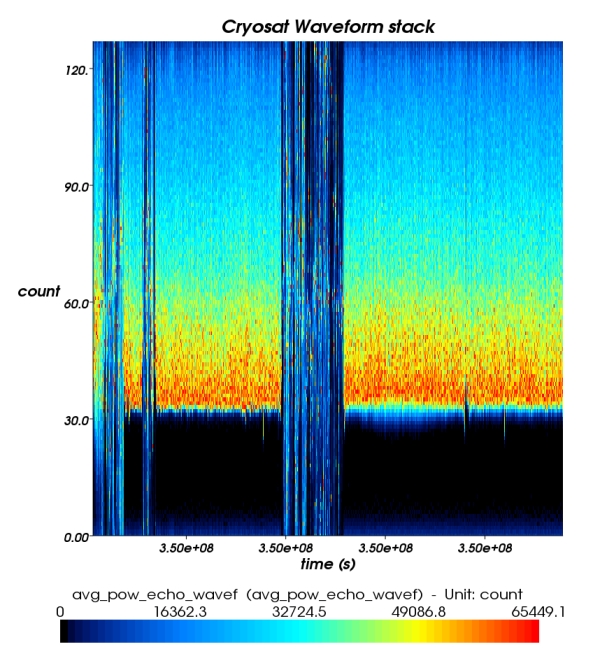
Figure 4: Stacked CRYOSAT Waveform Samples Along Time Using the Display Export function of the BRAT Tool (Credit: ESA/CNES)
The main BRAT functions are:
- data import and quicklook: basic tools for extracting data from standard formats and generating quick look images
- data export: output of data to the netCDF binary format, ASCII text files, or GeoTiff + GoogleEarth; raster images (PNG, JPEG, BMP, TIFF, PNM) of visualisations can be saved
- statistics: calculation of statistical parameters from data
- combinations: computation of formulas involving combinations of data fields (and saving of those formulas)
- resampling: over and under-sampling of data; data binning
- data editing: data selection using simple criteria or a combination of criteria (that can also be saved)
- exchanges: data editing and combinations can be exchanged between users
- data visualisation: display of results, with user-defined preferences. The viewer enables the user to display data stored in the internal format (netCDF).
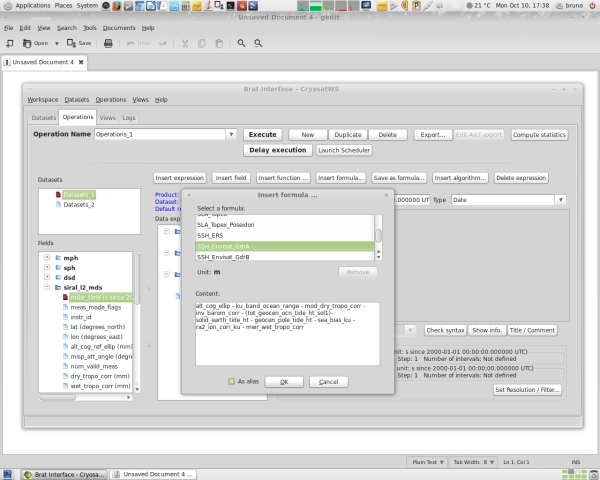
Figure 5: Insertion of Built-In Formula. BratGui (Credit: ESA/CNES)
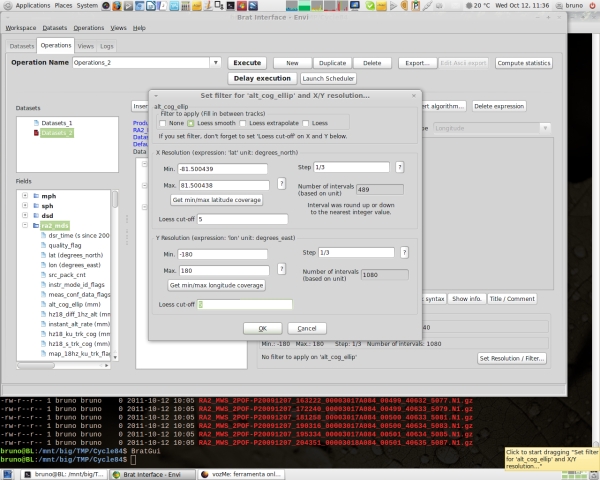
Figure 6: Resampling Options. BratGui (Credit: ESA/CNES)
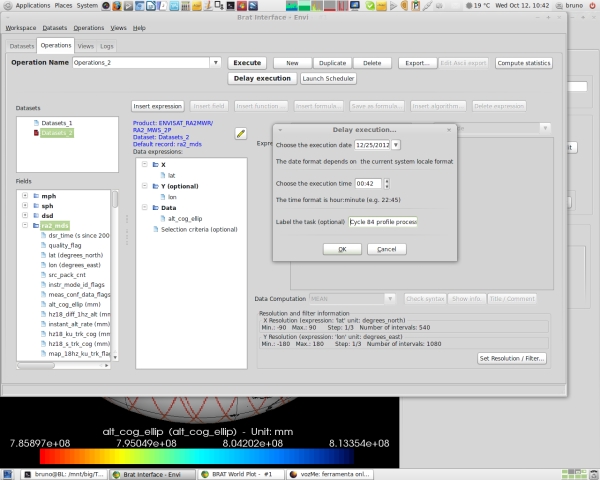
Figure 7: Delayed/Scheduled Execution. BratGui (Credit: ESA/CNES)
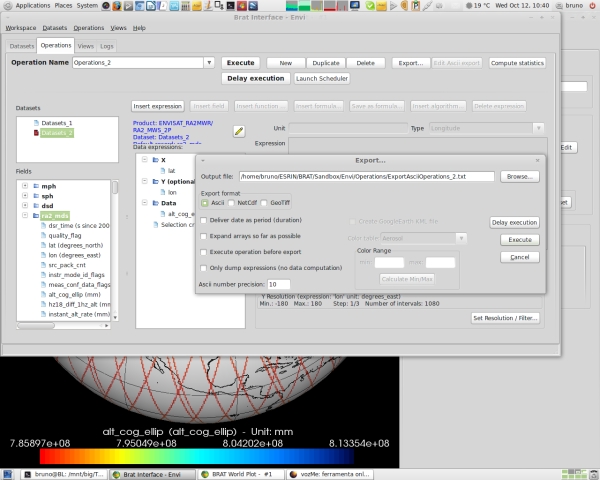
Figure 8: Exporting Data. BratGui (Credit: ESA/CNES)
BRAT downloads, user manual and installation procedures are available at the ESA data website.